



Reports
AffiliatePress Reports allows you to track and analyze the performance of your affiliate program in real time. Here you can track commissions, affiliate generated visits, affiliate growth, and payouts through visual charts, key metrics and detailed reports.
This article functions as a guide to the Reports available within AffiliatePress
Types of Reports Available
The AffiliatePress already gives you a quick overview of your complete affiliate program from its Dashboard. However, if you see something amiss or want detailed statistics and reports, head over to the AffiliatePress → Reports.
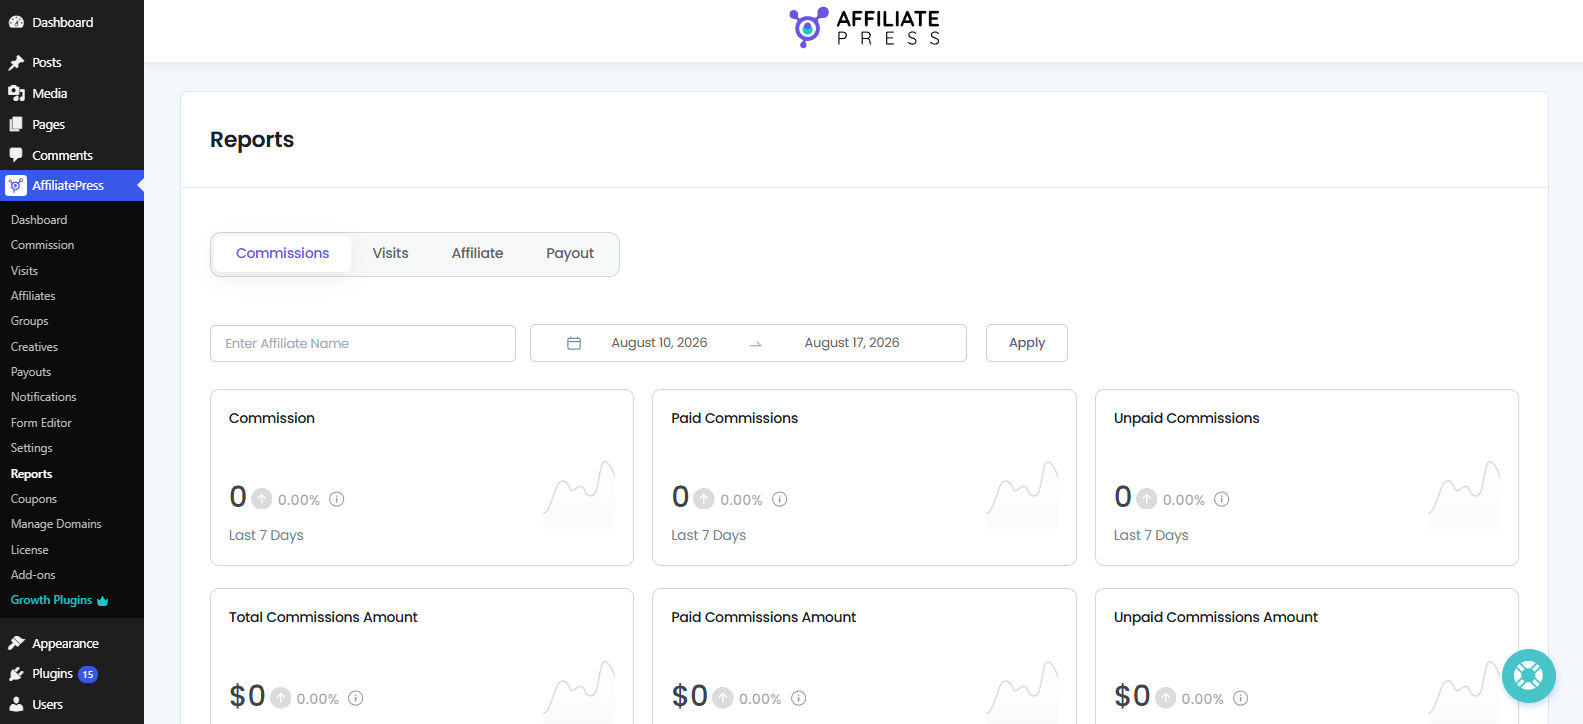
Here you’ll see four types of reports available:
- Commissions: Track commissions earned, payment status and trends over time.
- Visits: Monitor visits and conversions by affiliates
- Affiliate: Analyze affiliate registrations and top affiliates.
- Payout: Review paid/unpaid commission amounts and trends
Every report has filters, key metrics, visual charts and detailed data to help you evaluate your affiliate program performance and make decisions with real time data.
Let’s explore each of the report panels.
Commissions Report
The Commissions report lets you give you a complete overview of all commissions generated through your affiliate program.
From here, you can track commission activity, track paid and unpaid commissions, compare commission trends over time and analyze total commissions for a selected date range.
To access this report, go to AffiliatePress → Reports. By default, the Commissions tab opens when you visit the Reports page.
Filters Available
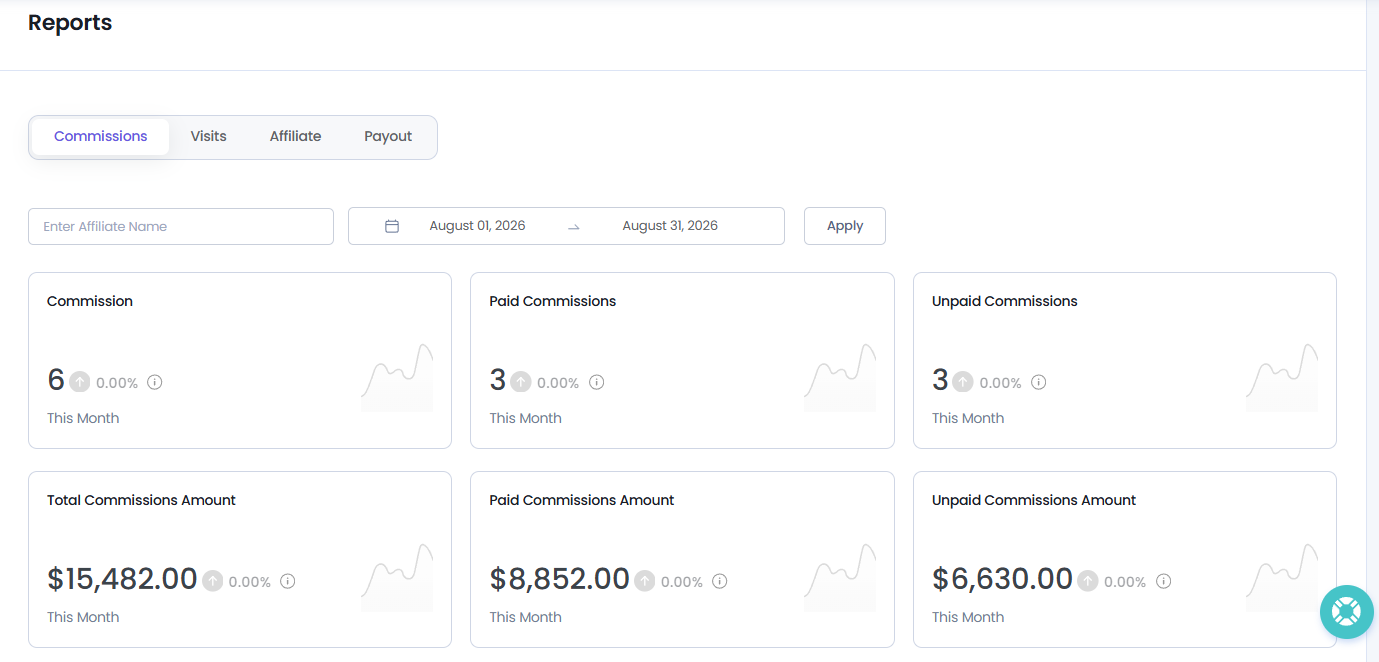
First of all, you can you can update and change the all below key metrics of report using:
- Affiliate Name: Search and view commission data for a specific affiliate.
- Date Range: Select a custom date range to view commission reports for specific dates.
Furthermore, you can also directly select the predefined in-between dates from the date range filter as of:
- Today
- Yesterday
- This Week
- Last Week
- Last Month
- This Month
- 30 Days
- 6 months
- Last Year
After selecting the filters, click Apply to refresh the report.
Key Metrics
The Key Metrics section gives you a quick snapshot of your commission performance.
Commission
Displays the sum of all commissions generated within the selected timeframe.
Paid Commissions
Commissions that have been verified and paid its count will be displayed here.
Unpaid Commissions
Commissions that are under review and awaiting approval.
Total Commissions Amount
All the Commissions that have been generated for the date range selected will show up
Paid Commissions Amount
The amount of all the paid commissions will be displayed.D
Unpaid Commissions Amount
The amount of all the unpaid commissions will show up here.
Each metric also displays the percentage increase or decrease compared to the previous reporting period. This feature lets you quickly track the performance changes.
Trend Chart
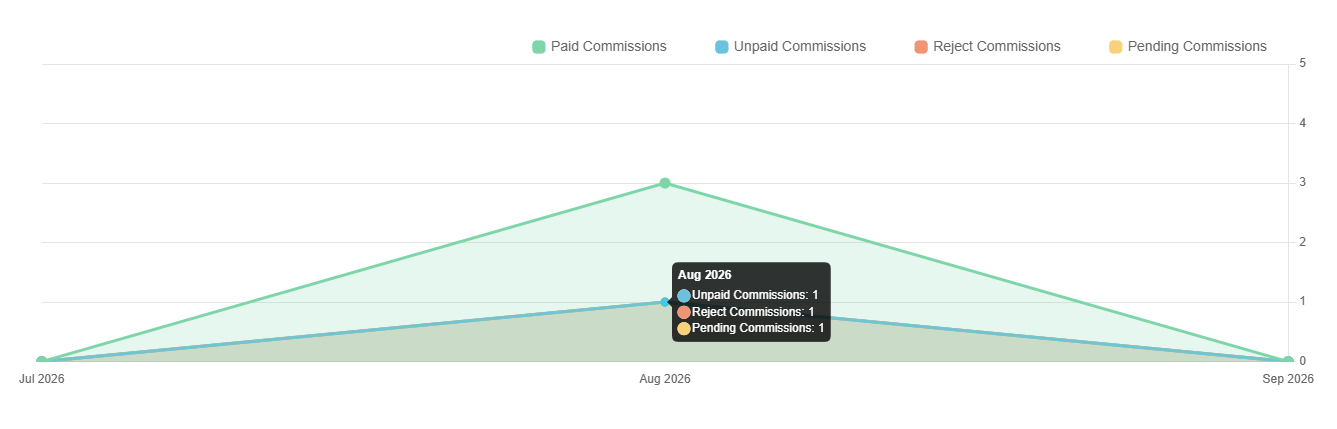
If you scroll down, you’ll be able to see the Trend Chart which shows a visual representation of commission activity over the selected date range.
The chart uses color coded indicators to show different commission statuses:
- 🟢 Green: Paid Commissions
- 🔵 Blue: Unpaid Commissions
- 🔴 Red: Rejected Commissions
- 🟡 Yellow: Pending Commissions
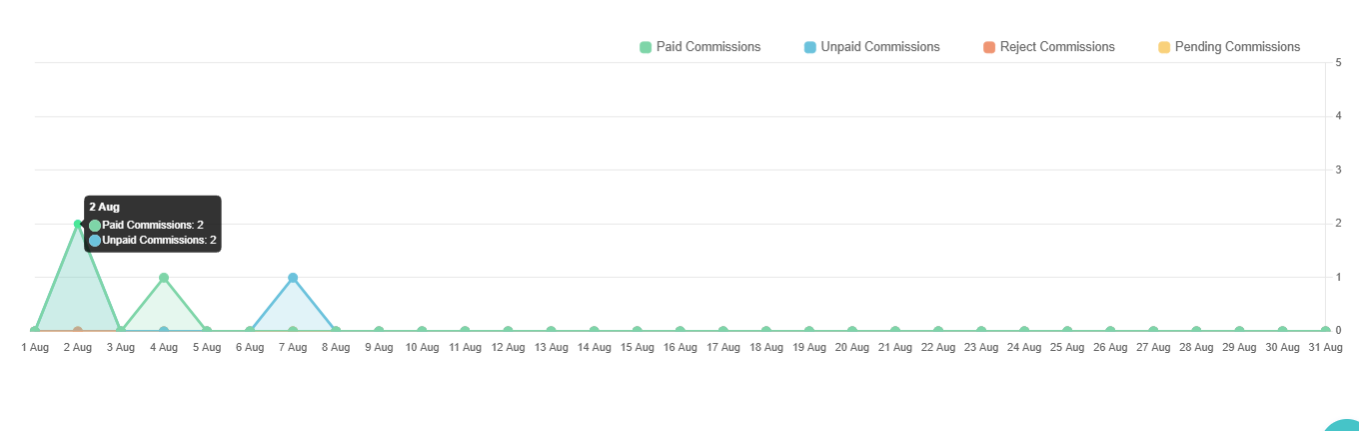
This chart makes it easy to compare commission trends, identify payment patterns and monitor the status of commissions over time.
Note: If no commission data shows, verify that commissions have been generated during the selected date range and that the applied filters match the available data.
Visits Report
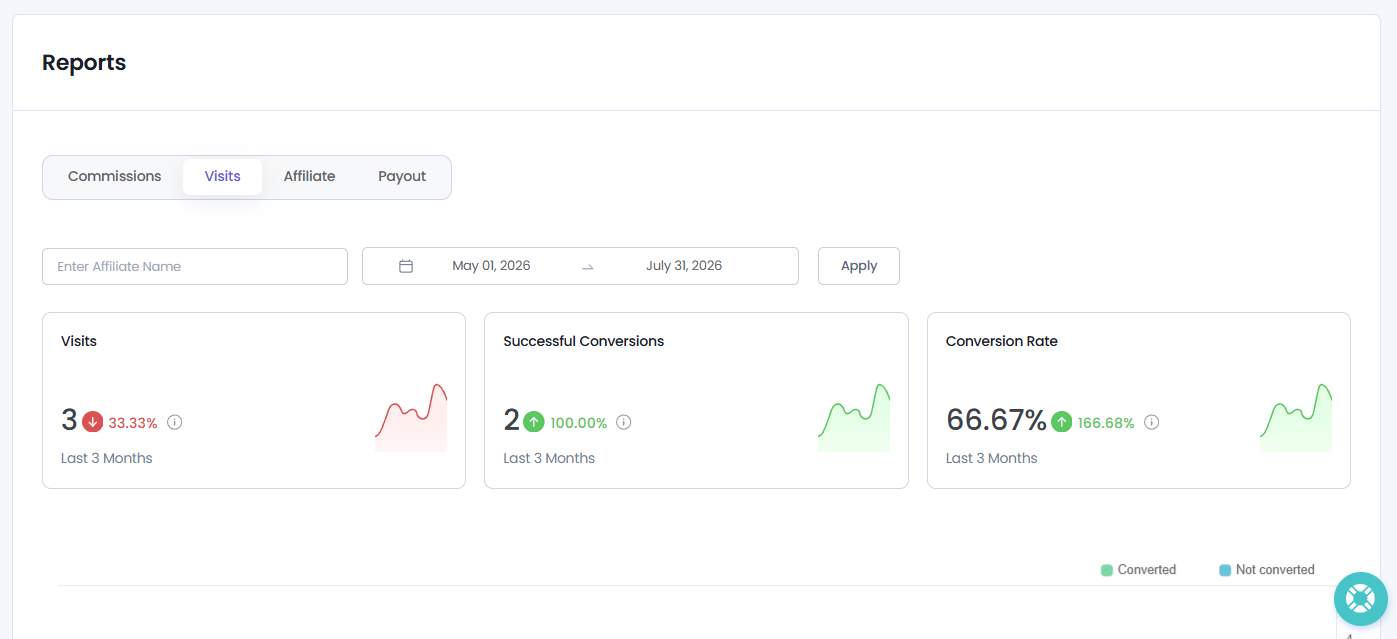
The Visits report tracks the traffic generated by your affiliates. Along with conversion statistics, the report also shows your top landing pages and the websites that send the most affiliate traffic to your site.
Filters Available
You can filter the Visits report by:
- Affiliate Name Search Field
- Date Range filter
After selecting the filters, click Apply to refresh the visits report.
Key Metrics
The Key Metrics section gives you a quick over of your affiliate traffic performance.
Visits
The total number of visits generated by affiliate referral links during the selected dates.
Successful Conversions
The number of visits that successfully converted into referrals or sales.
Conversion Rate
Shows the percentage ratio by calculating the successful conversions and total visits.
Each and every metric card also shows the percentage increase or decrease compared to the previous reporting period. This helps you evaluate performance changes right away at a glance.
Trend Chart
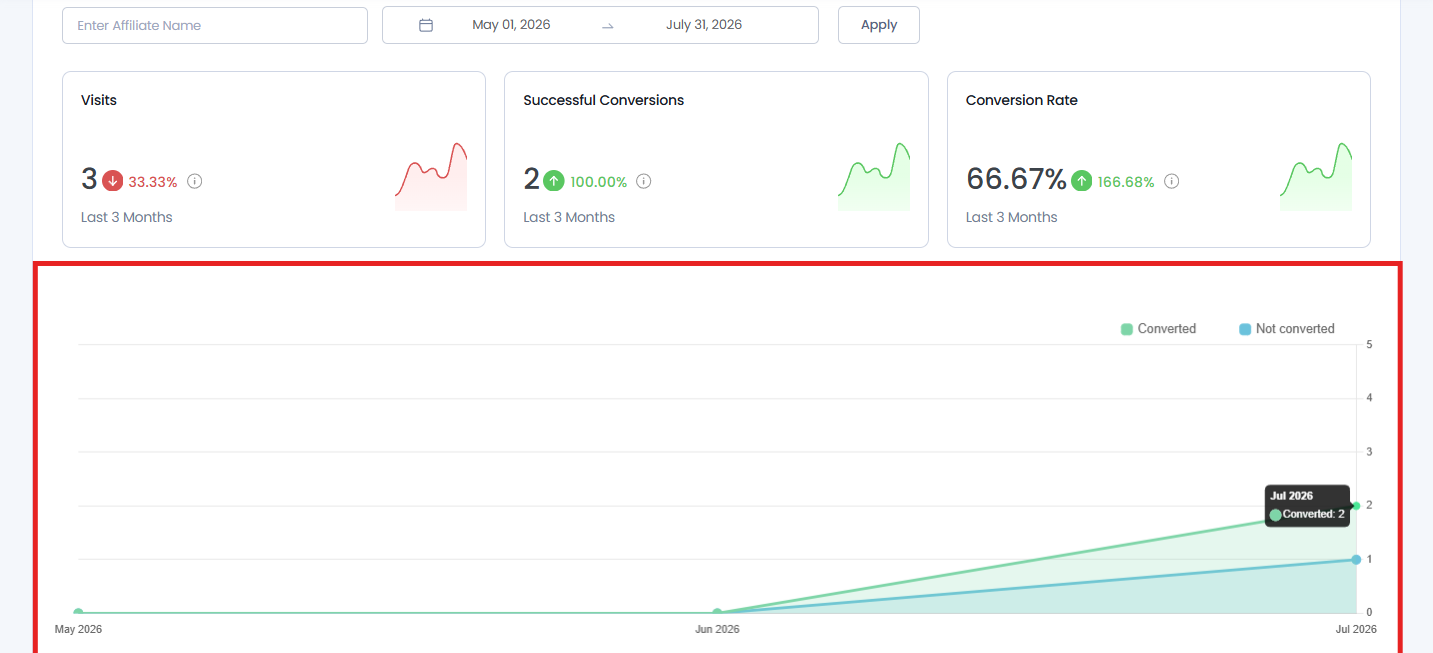
Now scroll down, and you’ll see the Visits Trend Chart that gives you a visual representation of affiliate visits over the selected date range.
The chart compares:
- 🟢Converted Visits
- 🔵Not Converted Visits
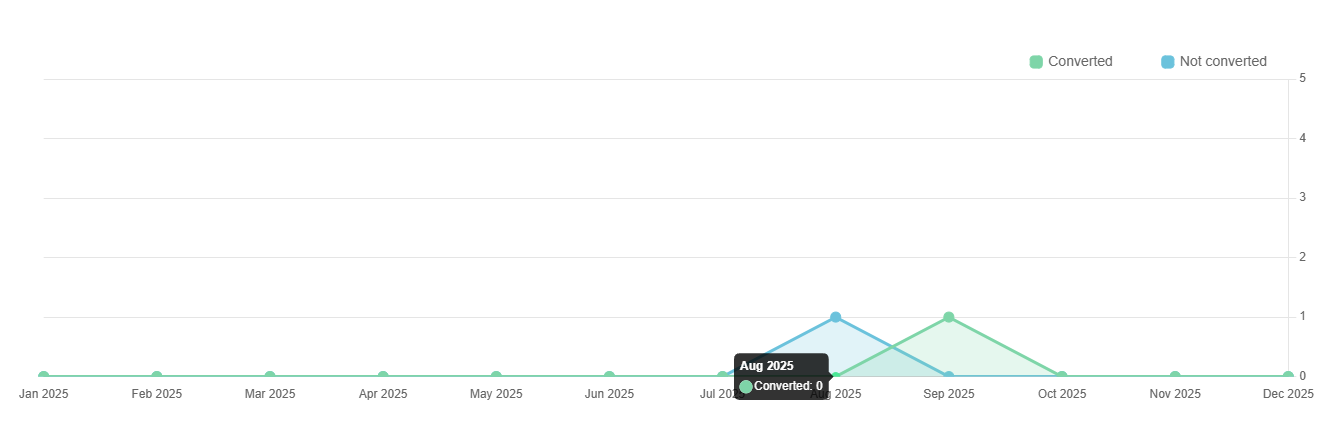
This makes it easier to understand traffic trends, compare successful and unsuccessful visits and track how affiliate traffic performs over time.
Note: If the report shows no visits or conversions, make sure affiliates are using their referral links and that the selected date range includes recorded visit data.
Top Landing URLs
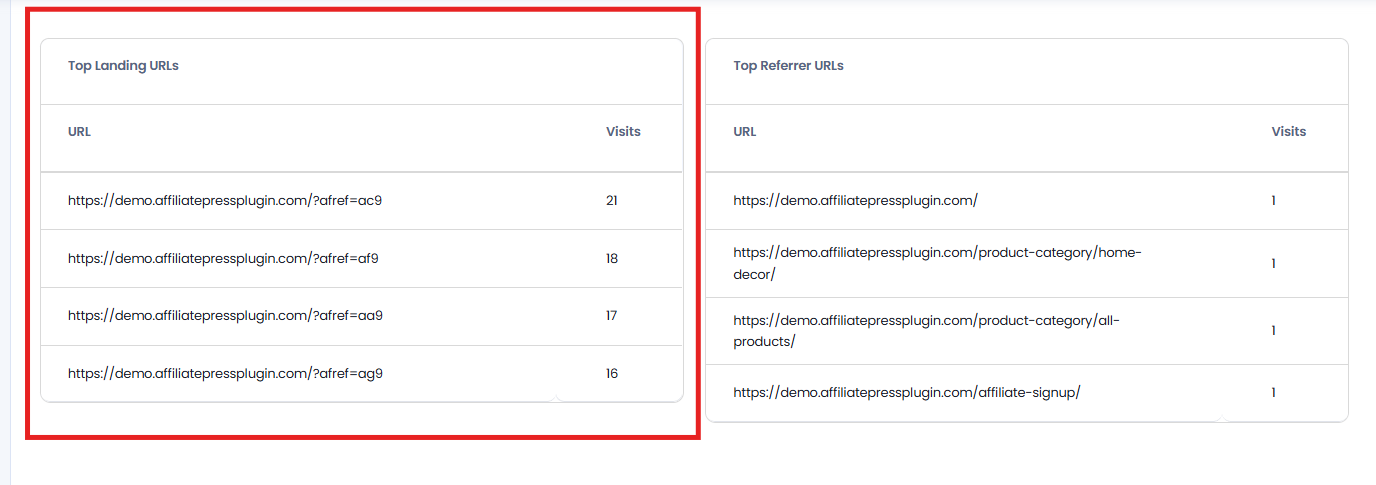
At last, the Top Landing URLs section lists the pages on your website that have the highest number of visits through affiliate referral links.
For each landing page, you’ll see:
- URL: The destination page visited via affiliate referral link
- Visits: Total number of visits
From here you can easily see which landing page attracts the most affiliate traffic and which pages perform best in your affiliate campaigns.This way you can recognize which landing pages attract the highest affiliate traffic and which pages may benefit from further optimization.
Note: Landing URLs are shown only after affiliate generated visits have been recorded.
Top Referrer URLs
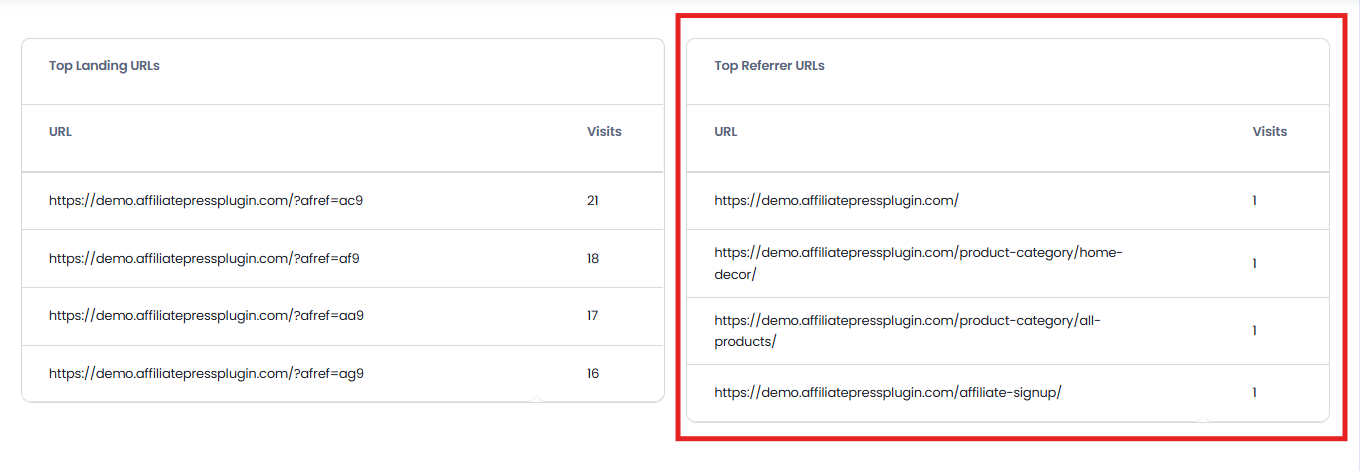
Right next to it, there’s the Top Referrer URLs section that shows all the websites or pages that generate the most affiliate referral traffic to your website.
For each referrer, you’ll see:
- URL: The referring website or page
- Visits: Total number of visits
This data is useful when you try to understand where your affiliate traffic originates and recognize your highest performing referral sources.
Note: Referrer URLs appear only when visits originate from external websites or pages that pass referrer information.
Affiliate Report
The Affiliates Report gives you all the insights you need into your affiliate network.
From this report, you can track new affiliate registrations, view your highest converting affiliate, recognize your top earner and understand affiliate approval trends over a selected period.
Filters Available
You can filter the Affiliates report using the Date Range filter only. After selecting the in-between date range, click Apply to refresh the report.
After selecting the in-between date range, click Apply to refresh the report.
Key Metrics
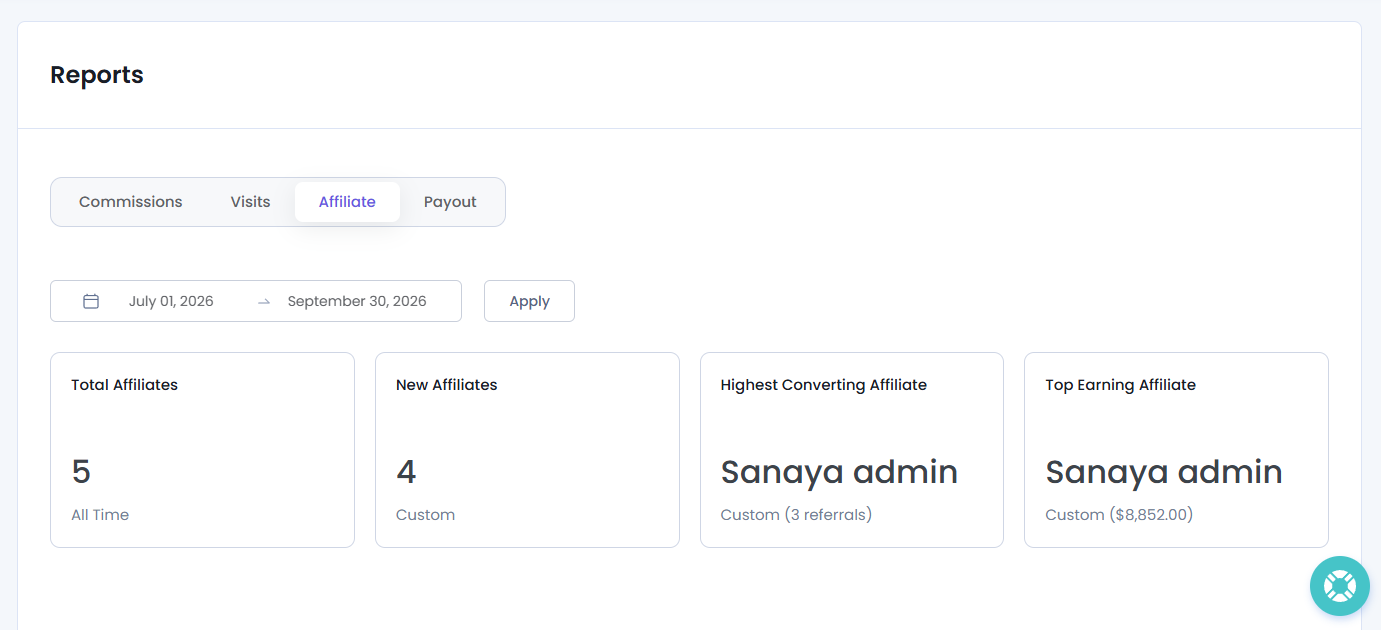
The Key Metrics section gives you a quick snapshot of all affiliate statistics in summary cards.
Total Affiliates
Shows the total number of affiliates registered in your affiliate program.
New Affiliates
The number of affiliates who joined during the selected date range.
Highest Converting Affiliate
The name of the affiliate with the highest number of successful referrals during the selected in-between dates.
Top Earning Affiliate
The affiliate’s name who earned the highest commission amount during the selected date range.
These metrics lets you evaluate affiliate growth and recognize your top performing affiliates. Plus, you can also see the number of referrals next to the Highest Converting Affiliate, and the total number of commissions earned by the Top Earning Affiliate.
Trend Chart
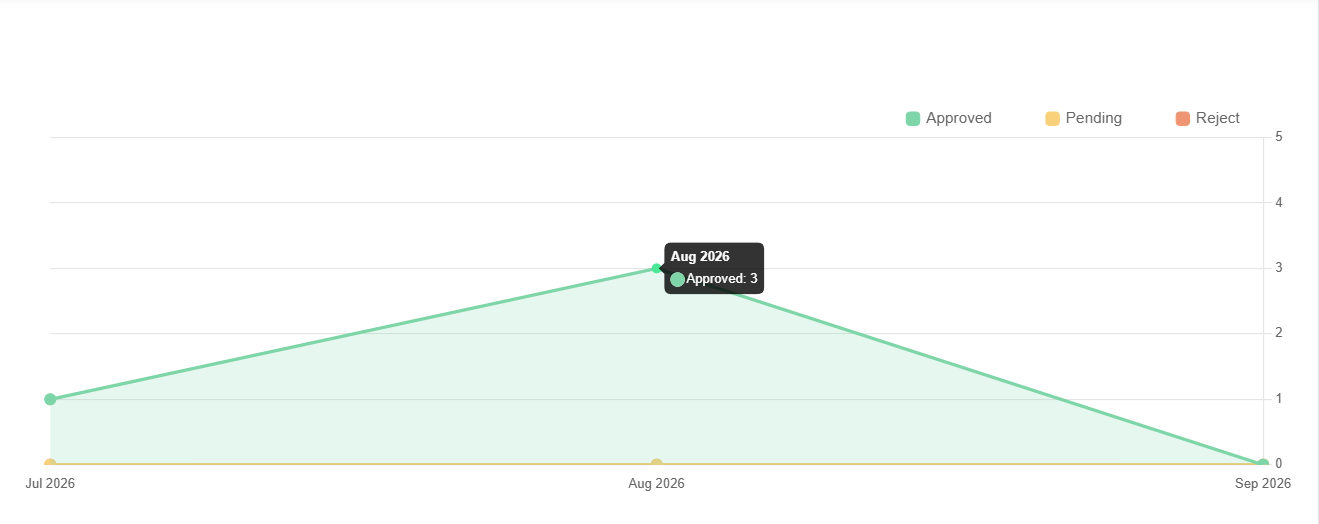
The Trend Chart shows you a visual overview of affiliate registration activity over the selected date range.
The chart uses color coded indicators to show affiliate registration statuses:
- 🟢 Approved: Affiliates whose registrations have been approved.
- 🟡 Pending: Affiliates whose status is pending; awaiting for approval.
- 🔴 Rejected: Affiliates whose registrations have been rejected.
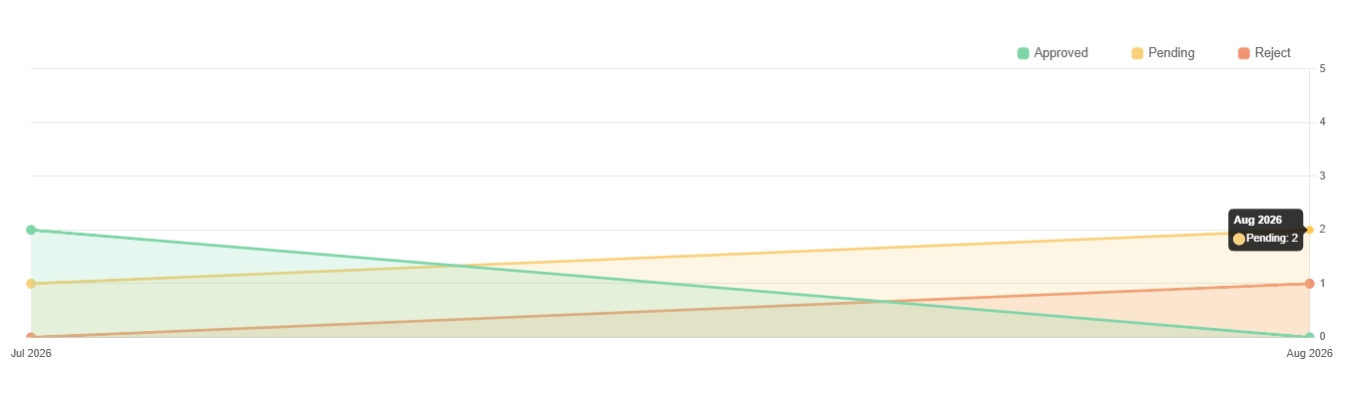
You can use this chart when you wanna track affiliate registration trends over time.
Note: If no affiliate data appears, check that affiliates have registered during the selected date range or adjust the date filter.
Payout Report
If you want to understand your affiliate commission payments and track your payout activity over time, jump straight to Payout report.
From this report, you can review total commission amounts, track paid and unpaid payouts and analyze payment trends for a selected period.
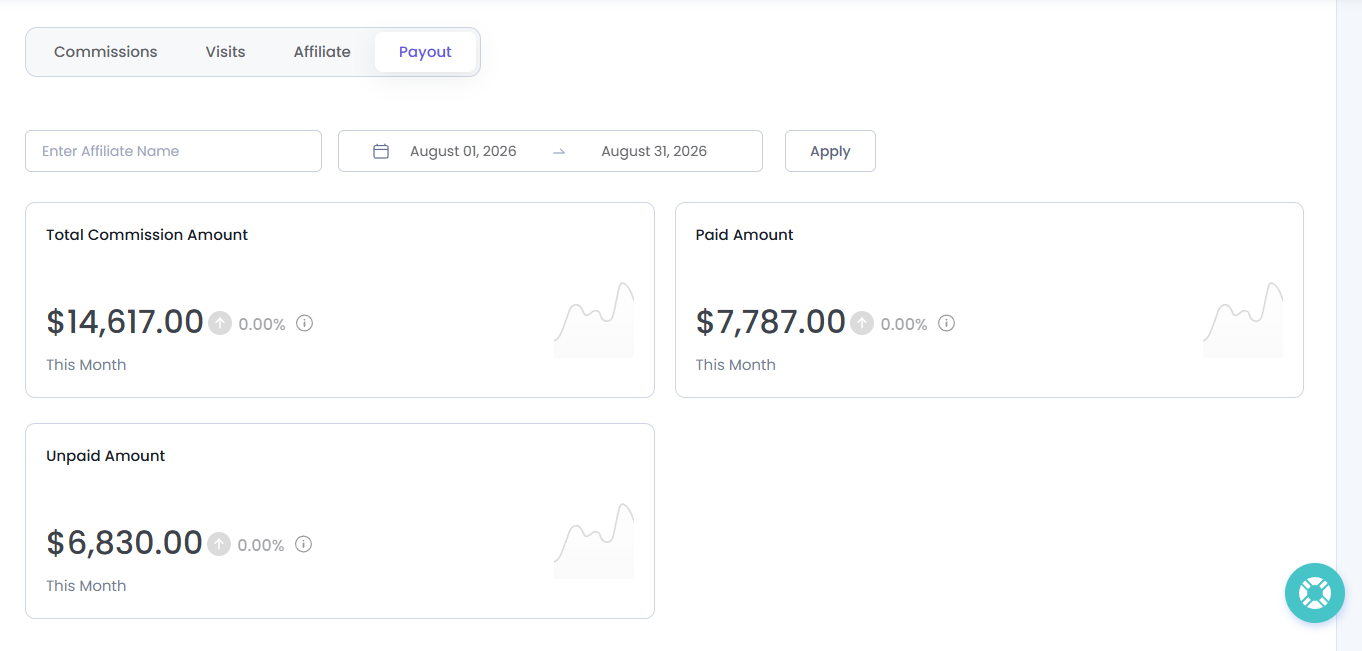
Filters Available
You can filter the Payout Report using:
- Affiliate Name Search Field
- Date Range
After selecting the filters, click Apply to refresh the report.
Key Metrics
The Key Metrics section shows you a quick overview of your affiliate payout activity in three summary cards.
Total Commission Amount
The total commission amount generated during the selected period.
Paid Amount
The total commission amount that has already been paid to affiliates.
Unpaid Amount
The total commission amount that is still pending payout.
Each metric in the KPI card also shows the percentage increase or decrease compared to the previous reporting period so you can quickly identify changes in payout activity.
Trend Chart
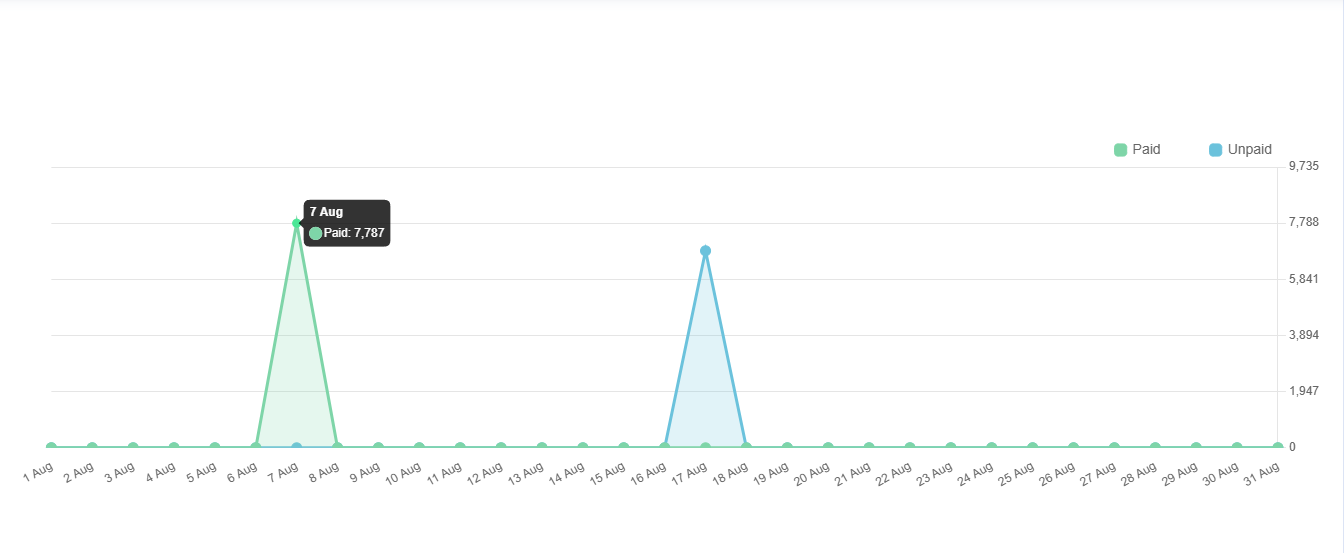
The Trend Chart here gives you a visual representation of payout activity over the time.
The chart shows the following payout statuses:
- 🟢 Paid Amount
- 🔵 Unpaid Amount
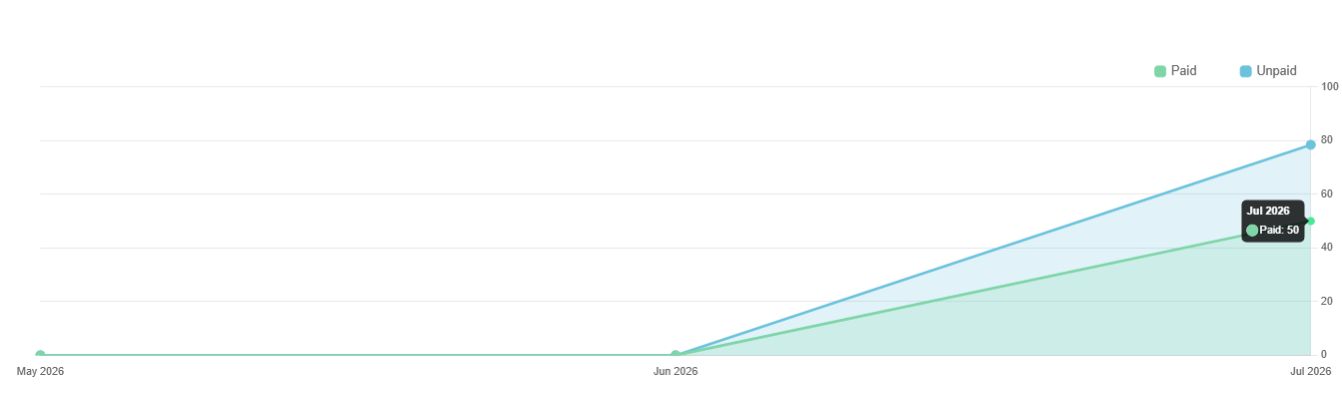
Using this chart, you can quickly identify traffic spikes, seasonal changes or sudden drops in affiliate performance.
Note: Payout data is available only after commissions have been generated. If the report is empty, verify that the selected date range has the commission records.