


Reports
To manage Reports, go to your WordPress Admin Dashboard and navigate to AffiliatePress > Report.
The Reports section in AffiliatePress provides a centralized dashboard for monitoring and analyzing the performance of your affiliate marketing efforts. This section equips administrators with the ability to track key performance indicators (KPIs) across multiple dimensions—Commissions, Visits, Affiliates, and Payouts.
Accessing Reports:
To access the Reports section, go to: WordPress Admin > AffiliatePress > Reports
By default, the Commissions tab is selected when the Reports section is opened.
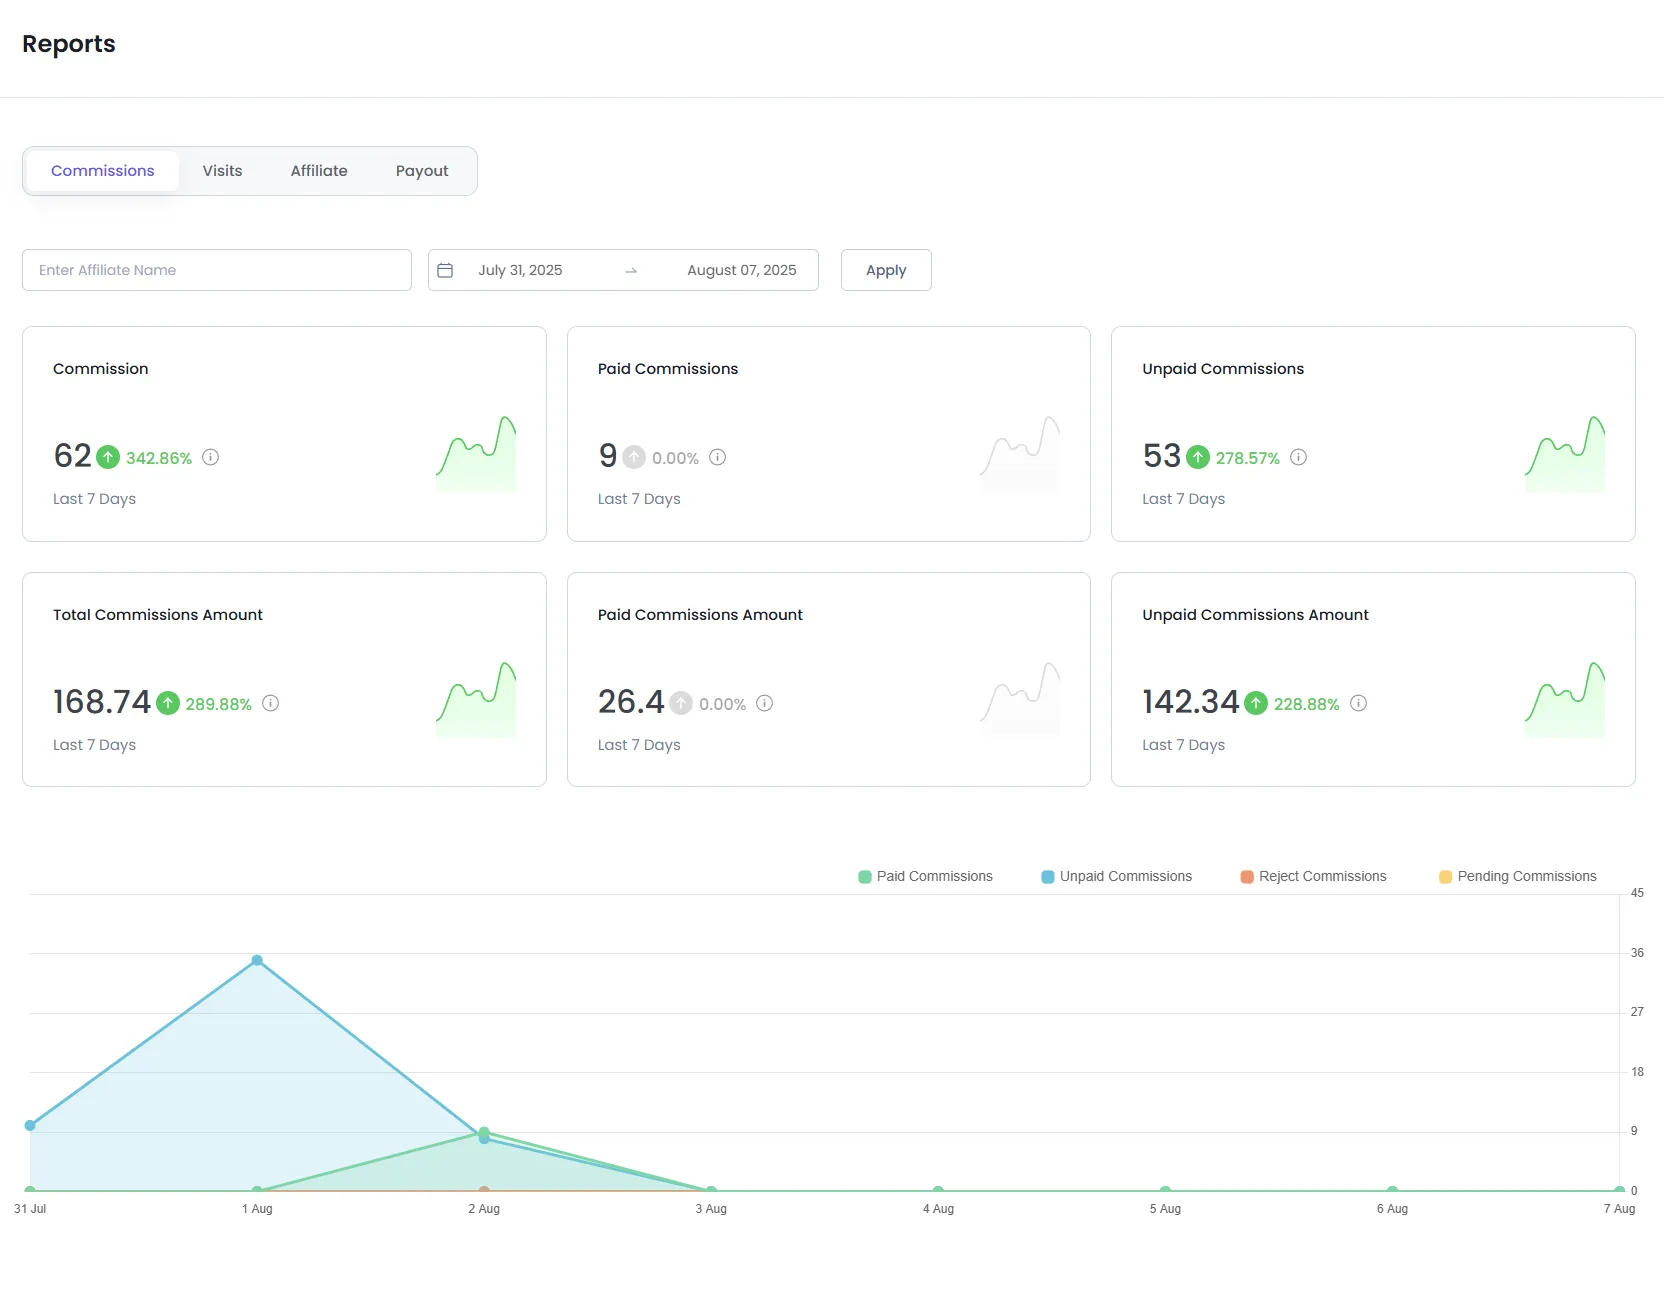
Commissions Report
The Commissions tab displays detailed breakdowns of the commissions generated by affiliates over various timeframes. Administrators can use filters to view data based on:
- Affiliate Name – Search and analyze data specific to an individual affiliate.
- Date– Filter the custom date range and click on the Apply button to show the reports of that particular date range.
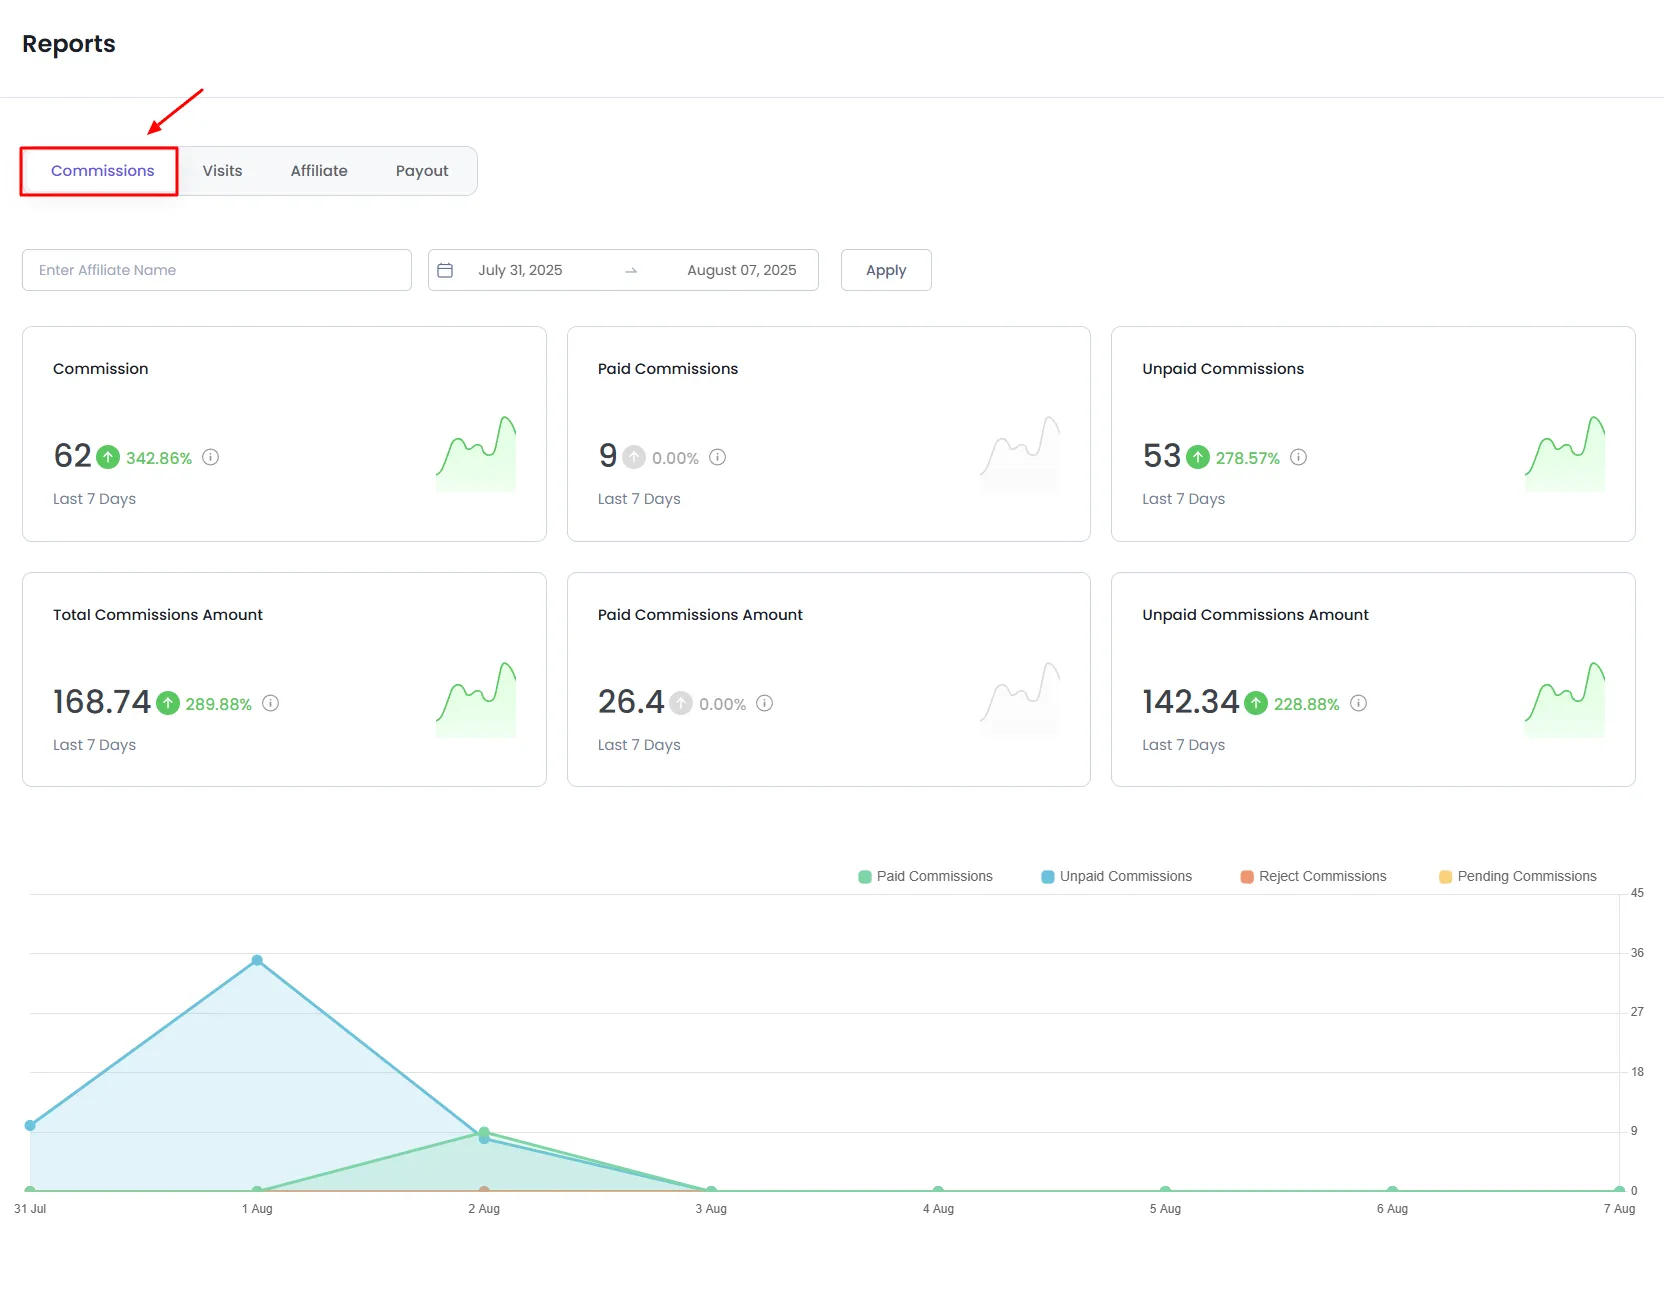
Key Metrics:
- Total Commission
Displays the sum of all commissions generated within the selected timeframe. - Paid Commissions
Commissions that have been verified and paid its count will be displayed here. - Unpaid Commissions
Commissions that are under review and awaiting approval. - Total Commissions Amount
All the Commissions that have been generated for the date range selected will show up - Paid Commissions Amount
The amount of all the paid commissions will be displayed. - Unpaid Commissions Amount
The amount of all the unpaid commissions will show up here.
Each metric includes a percentage indicator comparing performance to the previous equivalent period (e.g., last 7 days vs. prior 7 days), along with trend graphs for visual insight.
Visits Report
The Visits tab offers insight into traffic driven by affiliates and how well those visits are converting into sales or actions.
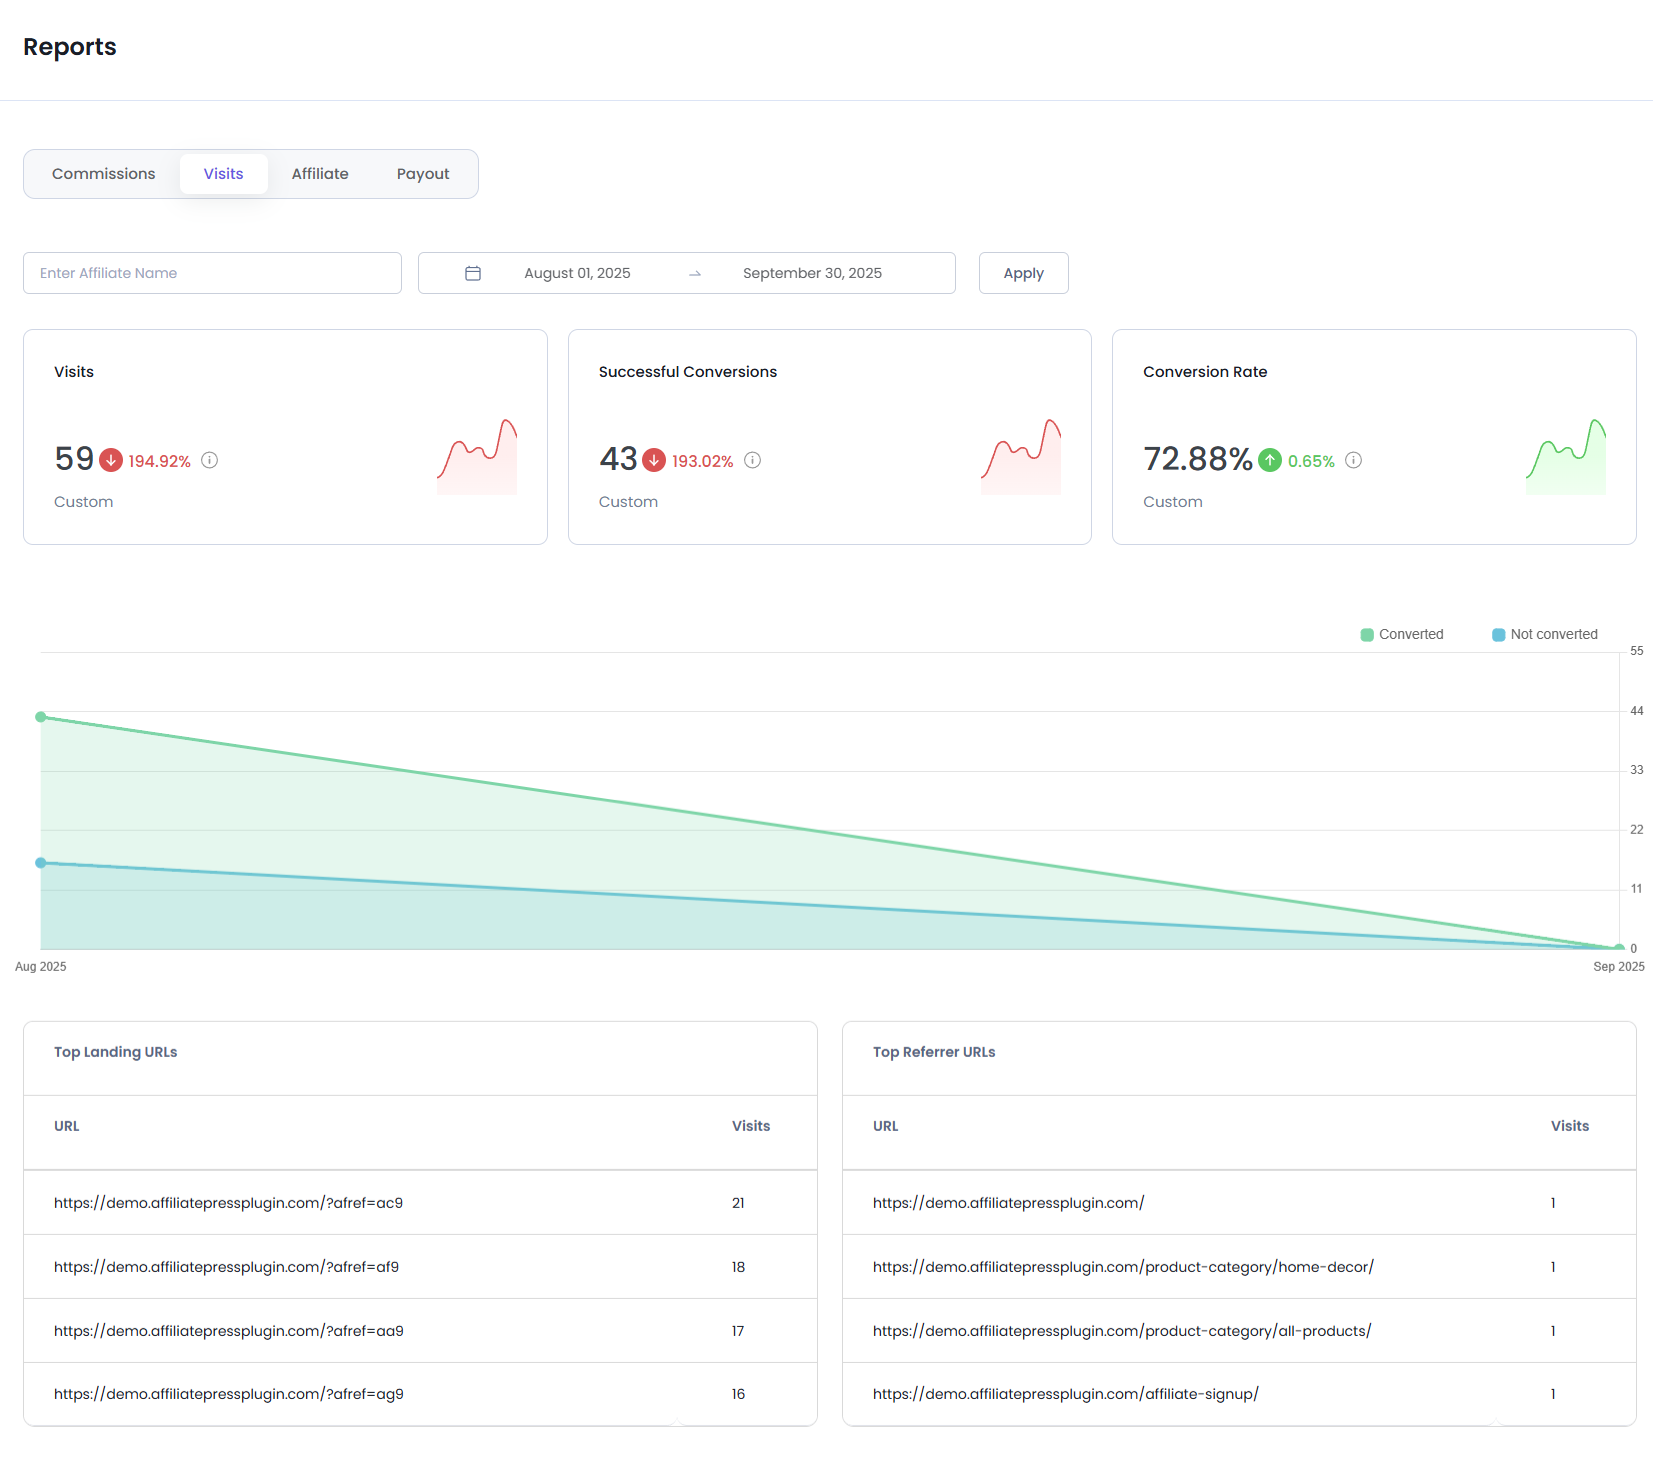
Filters:
- Affiliate Name – Search and analyze data specific to an individual affiliate.
- Date– Filter the custom date range and click on the Apply button to show the reports of that particular date range.
Key Metrics:
- Visits
Total number of user visits generated via affiliate links. The percentage shows growth or decline compared to the previous period. - Successful Conversions
The number of visits that resulted in a successful referral or sale. This metric reflects affiliate effectiveness. - Conversion Rate
Calculated as:Successful Conversions / Total Visits × 100
It provides a quick indicator of how efficiently affiliate traffic is converting.
The area chart below the metrics visually compares converted vs. Not converted traffic over time.
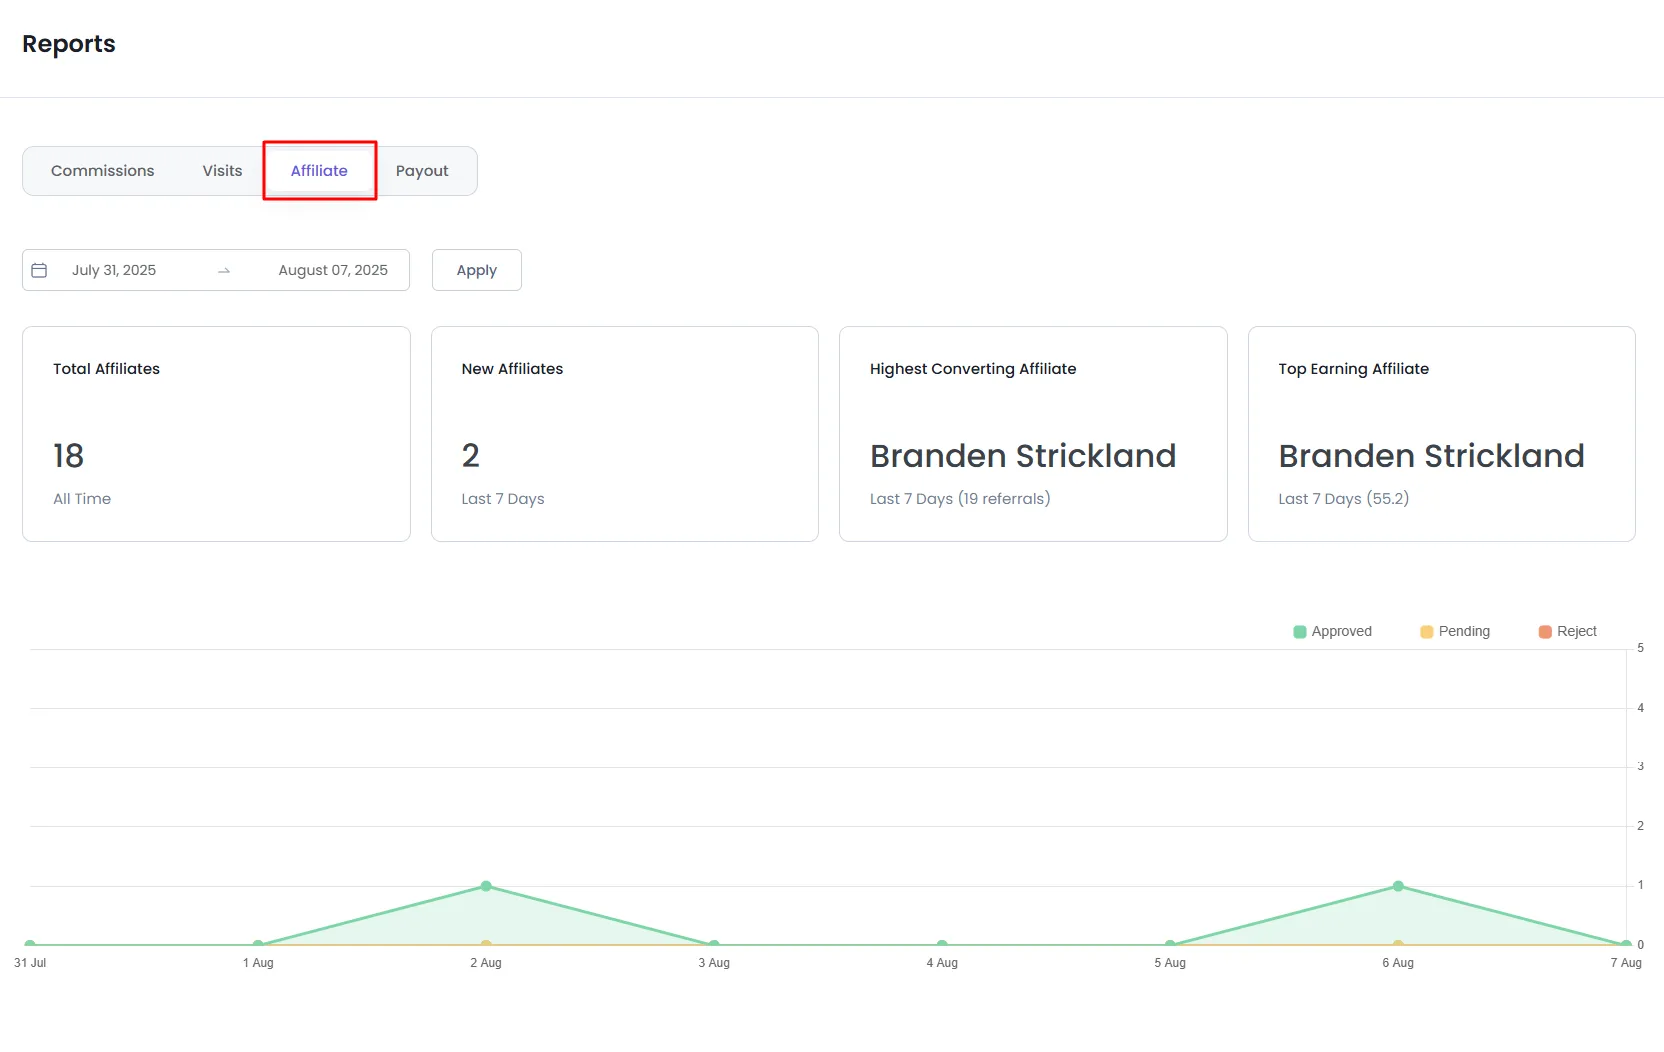
Affiliates Report
This tab gives a holistic view of your affiliate base and their activity over time.
Filters:
- Date– Filter the custom date range and click on the Apply button to show the reports of that particular date range.
Key Metrics:
- Total Affiliates
Shows the cumulative number of affiliates in the system. - New Affiliates
Number of new affiliates who signed up during the selected period. - Highest Converting Affiliate
Highlights the affiliate with the highest number of successful referrals. Includes the referral count and timeframe. - Top Earning Affiliate
Displays the affiliate who earned the highest commission amount in the selected timeframe.
A line graph underneath illustrates affiliate activity, segmented by Approved, Pending, and Rejected statuses, for clear trend analysis.
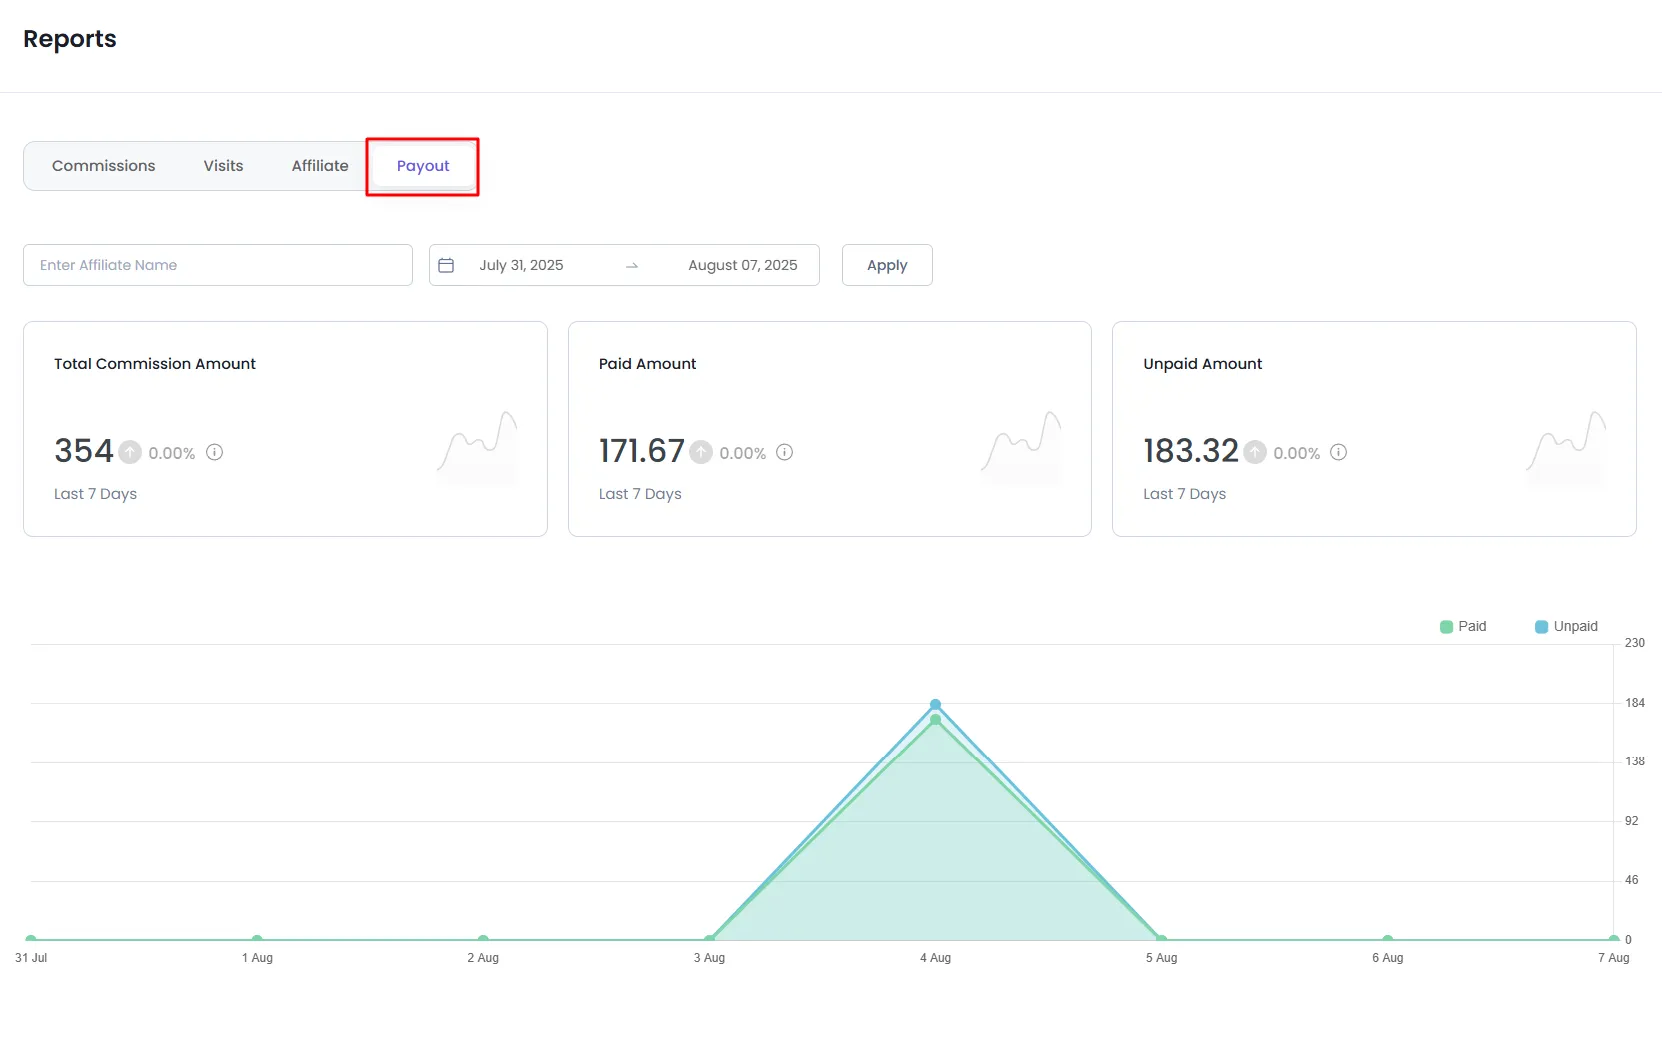
Payout Report
The Payout tab provides insights into commission payments—both completed and outstanding.
Filters:
- Affiliate Name – Search and analyze data specific to an individual affiliate.
- Date– Filter the custom date range and click on the Apply button to show the reports of that particular date range.
Key Metrics:
- Total Commission Amount
Total dollar amount calculated for affiliate payouts during the selected timeframe. - Paid Amount
Amount that has been successfully paid out to affiliates. - Unpaid Amount
Remaining amount yet to be paid out. Useful for tracking pending obligations.
Each section includes a small trend graph and percentage difference from the prior period, helping you track payment patterns and delays.
Data Comparison
All reports (except for the Total Affiliates count, which is cumulative) provide period-over-period comparisons:
- The percentage change (positive or negative) is displayed next to each metric.
- These comparisons help identify performance improvements or drops over time.
Status Indicators
At the bottom of the report interface, a legend is available to identify commission status using color-coded indicators:
- Paid Commissions – Green
- Unpaid Commissions – Blue
- Rejected Commissions – Red
- Pending Commissions – Yellow